NEW DEMO
ARCS, CIRCLES, WHEELS, and a bit of MATH
In Mathematics, an "ARC" is a smooth curve joining two endpoints. In general, an arc is one of the portions of a circle which is a part of the circumference of a circle. An arc can be a portion of some other curved shapes like an ellipse but mostly refers to a circle. A straight line joining the ends of the arc is called the chord of the circle. For more information, click the following link: ARC description.
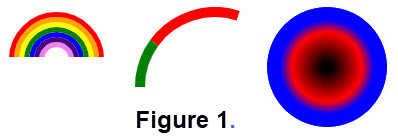
Figure 1 provides samples of items that are based on arcs. We intend to describe how arcs are used to generate such pictures and briefly discuss how to use commands in javascript to obtain such images. For we will use some mathematics for arcs and circles together with color features.
Just to keep things straight, an "ARCH" is different than an arc. "An arch is a vertical curved structure that spans an elevated space and may or may not support the weight above it, or in case of a horizontal arch like an arch dam, the hydrostatic pressure against it." For more information, click the following link: WIKIPEDIA:It includes a diagram of a Masonary ARCH. For pictures of an arch just use a search in your browser.
Lets review items about circles and their connections to arcs.
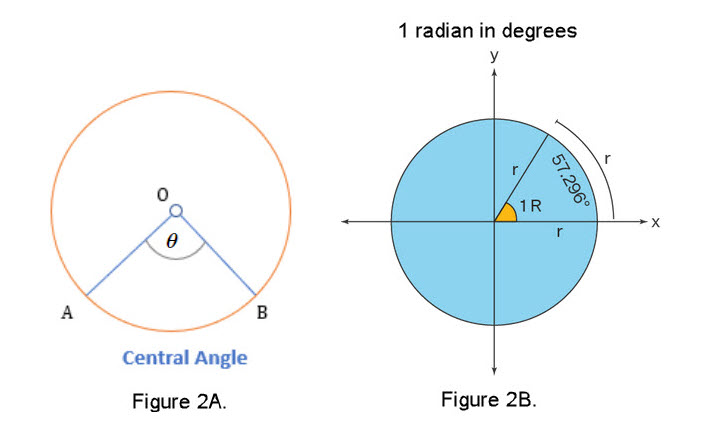
Figure 2A originally appeared in Circle Properties. and Figure 2B originally appeared in Radian to Degrees. but we slightly modified both of them for this demo.
In order to use circles and arcs in this demo we need a way to create arcs like in Figure 1. Our tool for doing this in javascript is the "arc Method" comand which interpets some input data to create the figures. This command has a set of other commands which help finish the arcs that appear on a screen. For now we focus on the data needed by the arc Method. Certainly since we are dealing with circular arcs we need a center (x ,y), a radius, where the arc is to start on the circle, where it will end of the circle, and the direction you what to go around the circle, clockwise or counterclockwise. Figure 3 shows these items and uses the clockwise direction. It is important to know that you need to use radians for the start and end locations of the arc.
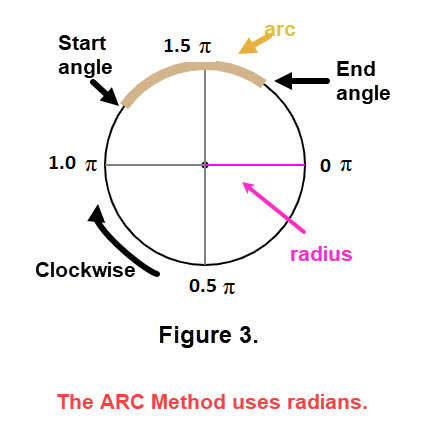
Lets inspect Figure 3 a bit. You will need several arc Method commands.
As mentioned above the arc Method command to get the tan arc requires "support" in order to achieve the graph of this arc along the circumference of the circle. One way to view the necessary "support" is to think of the arc Method command, which is ctx.arc(x, y, radius, startAngle, endAngle, counterClockwise); , as a star and the "support" as the cast of a play. To continue this interpretation, let the tan arc be considered an act of the play. Looking at Figure 3 we see that there are other acts like the center, the circle, etc. The act getting the tan arc is the following set of javascript code:
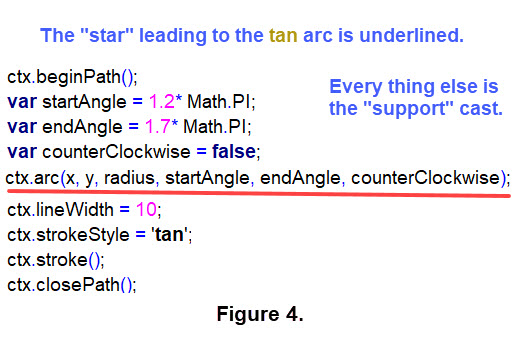
Next we will describe some features of the "act" in Figure 4. The data for the center (x, y) and the radius were set in a previous portion of javascript code. The act starts with "beginPath" and ends with "closePath". The portion of the angles, "Math.PI",is the way java script recognizes \(\pi\). The "stroke" items indicate the color to use and fill the arc. The line var counterClockwise = false; implies that the portion of the arc Method that indicates the direction around the circle will be clockwise. Finally the var and ctx are indicators to javascript for assigning a value and a functional content, respectfully. The indicator ctx is a abbreviation of "ConTeXt". For other acts different lines of code may be used. WARNING: there are many varieties of javascript and different ways that code lines are indicated. For a bit of history of javascript click on js versions or ECMAScript.
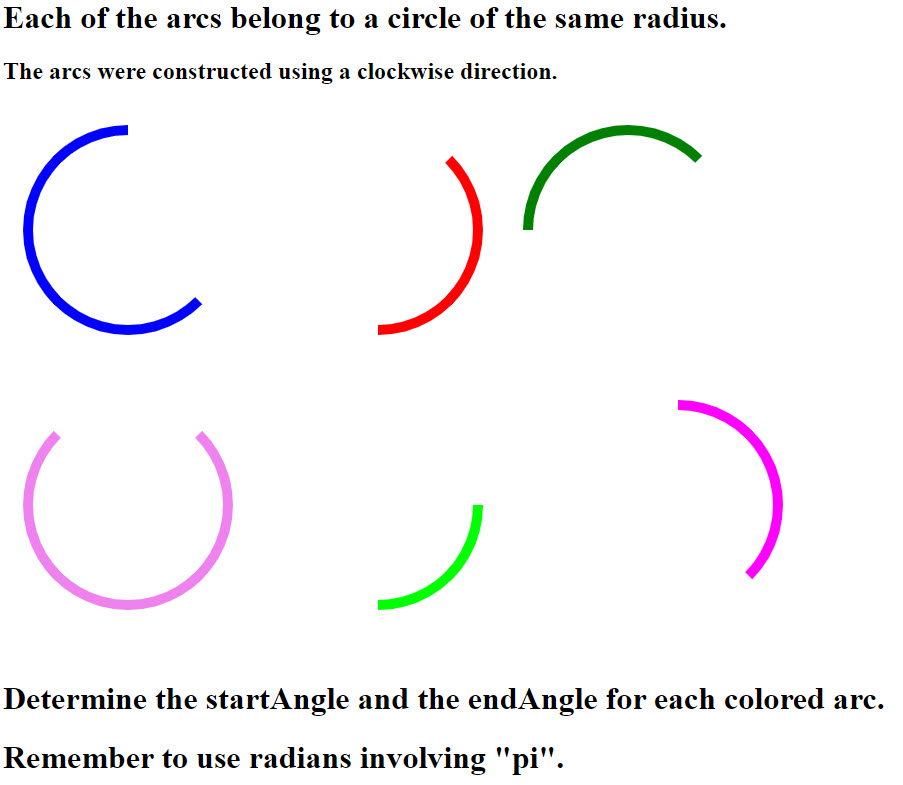
To get a feel for how circular arcs are "cut out of a circle" try to determine the startAangle and the endAngle for the arcs that are shown in a POPQUIZ just click on Arc angles quiz.
In Figure 1 we showed an arc with two components (click here to see Figure 1).
For each component we can construct an "act" with the details like those displayed in Figure 4. For instance, lets use the colors in a rainbow to obtain a circle with equal sized arcs.
The 7 colors in a rainbow are red, orange,yellow, green, blue, indigo, and violet. (These colors are often referred to as ROYGBIV as shown
![]() .
Click on the thumbnail image for a better view.
However, there are many more colors in a rainbow which are not visible.)
.
Click on the thumbnail image for a better view.
However, there are many more colors in a rainbow which are not visible.)
For our figure we construct 7 arcs, each requiring an arcMethod with "support" as discussed above.
The big step, mathematically, is to determine the startAngle and endAngle for each arc.
Referring to the information Figure 3 we have \(2*\pi\) radians to "break into" 7 equal pieces. For the first arc we can use startAngle = 0 and the endAngle = \(\frac{2}{7}*\pi\).
For the second arc use startAngle = \(\frac{2}{7}*\pi\) and endAngle = \(\frac{4}{7}*\pi\). Continuing until the 7-th arc has startAngle = \(\frac{12}{7}*\pi\) and endAngle = \(\frac{14}{7}*\pi\).
The resulting figure is 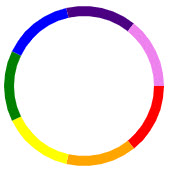 .
Click on the thumbnail image for a better view.
.
Click on the thumbnail image for a better view.
We can have circles in which the number of arcs vary quite a bit and the arcs are colored using a random selection. For instance, a circle with 20 arcs with various colors may look like
![]() .
Click the thumbnail image for a better view.
Note that some adjoining arcs are the same color.
.
Click the thumbnail image for a better view.
Note that some adjoining arcs are the same color.
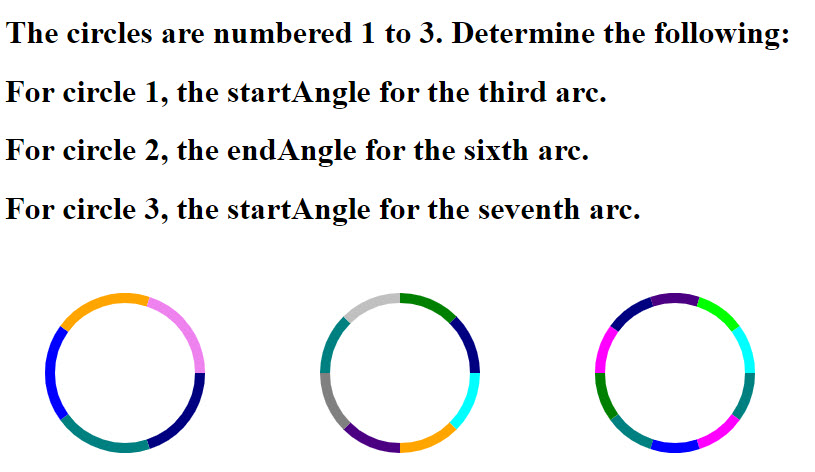
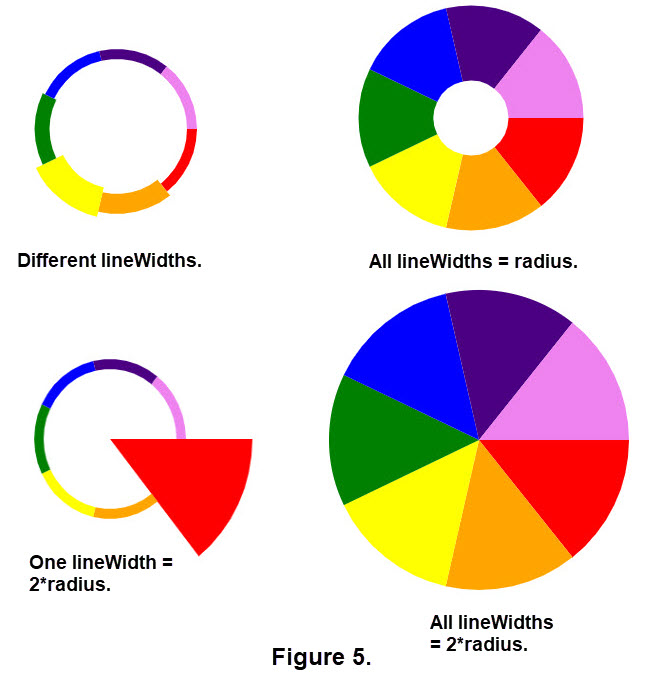
For more practice on identifying the startAngle and the endAngle for the circles with many arcs here is another POPQUIZ just click on Arc circles quiz. There are other manipultions we can use to change the image of the circles. For example, we can fill portions of a circle by changing the lineWidth of the arcs. (Look at the code in Figure 4.) If we make the lineWidth equal to the radius or even use double the radius the resulting figure can be partially or fully filled. Look at Figure 5 below. Also notice that the size of the circular image changed when the lineWidth was the radius and even larger when twice the radius was used. The figure in the lower right of Figure 5 is a color wheel.
Another way to use circles is to form RAINBOW (style) ARCs (see Figure 1) or even a BLACK HOLE image is to construct concentric circles.
Geometrically, objects are called CONCENTRIC if they share a common center. Concentric circles look like
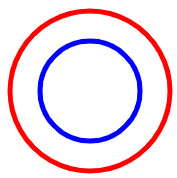 (click the thumbnail image for a better view),
but other objects like spheres or regular polygons can be concentric. In such cases the objects have the same center but have different radii.
For more information on concentric circles go to circle_in_a_circle.
(click the thumbnail image for a better view),
but other objects like spheres or regular polygons can be concentric. In such cases the objects have the same center but have different radii.
For more information on concentric circles go to circle_in_a_circle.
To construct RAINBOW (style) ARCs we will use semicircles. Just look at the two circles in the thumbnail image above and imagine drawing a horizontal diameter through the center.
We can have a number of concentric semicircles, then fill in between the circular arcs. Click on the following thumbnail image to get a good view.
![]()
We can do the same to get a rainbow arc with the 7 colors. It seems that people like various sizes of rainbows. To get a your choice of a size for a rainbow click on RAINBOW SIZES. (NOTE: the "sizcode" 1 is small; 2, 3, 4 increase the size and 5 is the largest.)
To create an image that might represent a black hole (see Figure 1) we need a way to have colors fade to add new dimension to the image. The process of gradient color will provide such a tool. You probably met gradients in calculus, but you used the word slope. Gradient is a measure of how steep a slope is. The greater the gradient the steeper a slope.
For this demo we have in mind that gradient is a gradual blending from one color to another. In Figure 1 we have red slowly transition into black, hence we imagen the image is a black hole.
Gradients may blend similar colors or completely different colors. There are several ways to blend colors; linear, radial, conic, diamond, and reflected.
Here is a thumbnail image
![]() of the five types; click it for a better view. Click here for more information.
of the five types; click it for a better view. Click here for more information.
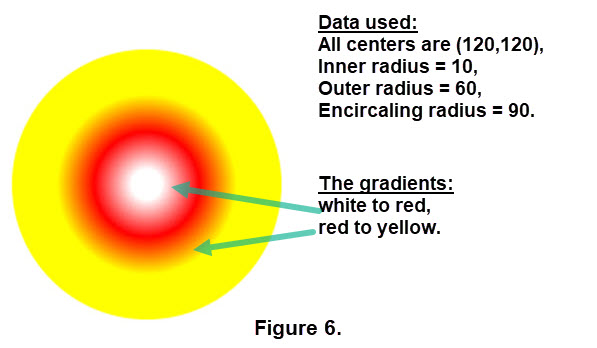
For this demo we will focus on radial gradients in circles. Similar to the arcMethod there is a createRadialGradient() method but this command requires two circles, a start circle and an end circle, and of course radii information. The expresssion for this command is var createRadialGradient(\(x_0\), \(y_0\), \(r_0\), \(x_1\), \(y_1\), \(r_1\)) where ( \(x_0\), \(y_0\)) is the center for the start circle with radius \(r_0\) and ( \(x_1\), \(y_1\)) is the center of the end circle with radius \(r_1\). For a radial gradient we will use another circle to surround the radial gradient image; the surrounding circle command is ctx.arc(x, y, radius, 0, 2 * Math.PI);. The centers need not be the same. Figure 6 below provides a look and points out the gradient applied.
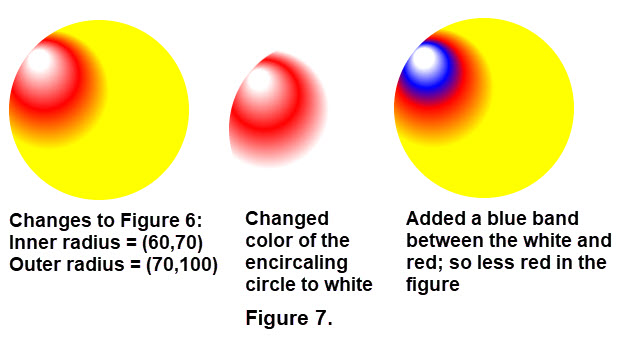
By changing the centers of the start and end circles we can change the image quite a lot. We can also add a band of another color between these circles. In addition we could change the color of the surrounding circle. Figure 7 displays some changes with explanations.
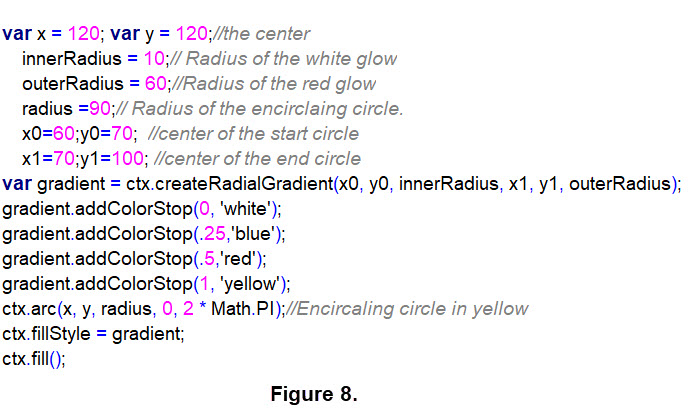
In order to obtain images in Figures 6 and 7 a lot of "steps" are needed in the javascript code. The start circle, end circle, and the surrounding circle for the gradient feature act as "boundaries". Each of these creates a color band.The start circle is labeled as the "zero" position and the end circle as the "one" position. Other positions between 0 and 1 can be used to insert more colorbands, like the blue band in Figure 7. Each decimal you choose from 0 to 1 is called colorStop. The colorStops provide a gradient change that transitions smoothly between them. ColorStops are declared with two parameters, the decimal position and the color of the stop. The color bands make up the gradient form into larger and larger circles as they transition from the center to the edge of the surrounding circle. Figure 8 shows (some of) the code used to obtain images in Figure 7.
The use of colorStops with gradients can provide a wide variety of images. For a small set of such images click the thumbnail
![]() .
For other examples and a discussion of colorStops go to
colorStop info.
.
For other examples and a discussion of colorStops go to
colorStop info.
We have constructed an activity for you to experiment with RadialGradients. (Optional of course!) The activity lets you choose the type of colors and the number of bands between the start circle and the end circle. The way to enter input to the activity is shown in Figure 9. Carefully read the information in Figure 9. To execute the activity click on GRADIENT activity.
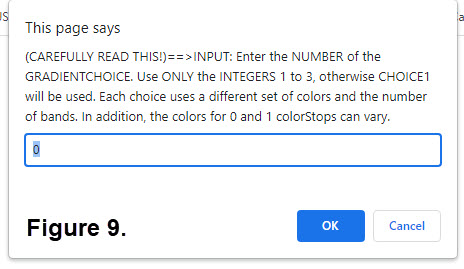
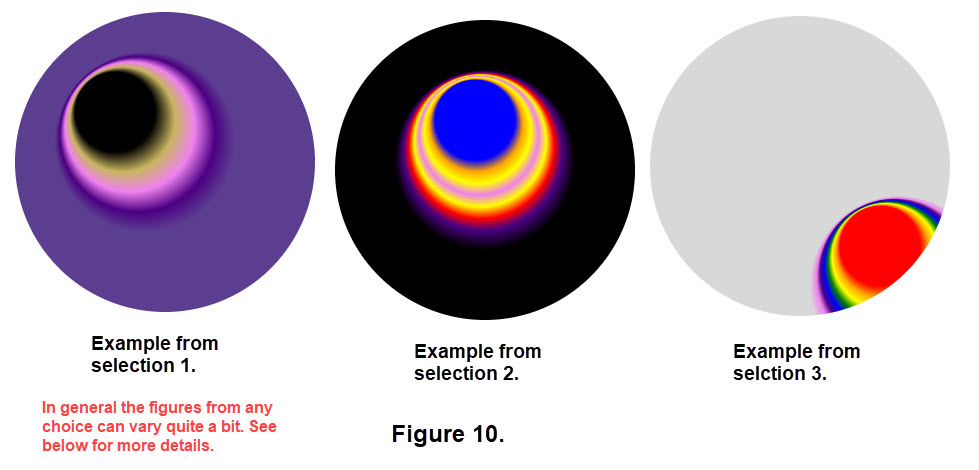
As a user all you need to do is enter the INTEGERS 1, 2, or 3 (they must be single integers). Once you have entered your choice click on OK or press ENTER. The result is a figure similar to those in Figure 10. Read over the details about the 3 choices below Figure 10. (NOTE: ROYGBIV are the rainbow colors.)
| Selection | Color Set | ColorStop 0 | Surrounding Color | Number of (internal) Bands | Color Choices for Bands |
|---|---|---|---|---|---|
| 1 | Very large set of colors | White or Black | Any in the color set | 2 | Any in the color set |
| 2 | ROYGBIV | Any ROYGBIV | Light Gray or Black | 6 | Any ROYGBIV |
| 3 | ROYGBIV | Red | Light Gray or Black | 6 | In the order of ROYGBIV |
Take a close look at the examples in Figure 10 and use the table to check the features of each of the selections. We recommend that you use each selection a number of times in the activity to get a feel for the gradients involved. We have generated random interger values for choosing centers of the start and end circles from a set of data pairs and the color choices on the 'internal' bands. The set of data pairs for the centers were chosen to emphasize the variety of colors and the form of Radial Gradients. (We deliberately did not use the color "white" for the surrounding color since the background, alias the "canvas", is white.) It is unlikely that the same figure will be regenerated when executing the activity. Feel free to use a screenshot and save some images for you personal use. We enjoyed trying to focus on several image styles.
An optional quick excursion to LinearGradients. A LinearGradient creates a color gradient along a line connecting two points, \((x_0, y_0)\) and \((x_1, y_1)\).
The command is similar to that for RadialGradients and has the form var gradient = ctx.createLinearGradient(x0,y0,x1,y1);. There are color stops but no surrounding circle.
In this case a rectangle can used. It has a form like ctx.fillRect(20,120,255,75); where the first two values give the coordinates for the top left corner of a rectangle
followed by the width and then the height. The color stops are between 0 and 1 the same as RadialGradients and instead of 'bands' rectangular blocks are generated. Here is
an example of the image obtained using 4 color stops with blue, aqua, pink and green.
![]() Click the thumbnail for a good look. The color stops used were 0, 0.25, 0.75, and 1.
Click the thumbnail for a good look. The color stops used were 0, 0.25, 0.75, and 1.
For more information on LinearGradients go to
Introduction to LinearGradients
or for an opportunity to manipulate sliders to create LinearGradients go to
Actually create LinearGradients.
For how to create a circlar figure like
![]() Circular gradient example.
For a good look click the thumbnial.
More mathematics is needed in this case.
Circular gradient example.
For a good look click the thumbnial.
More mathematics is needed in this case.
Previously we discussed creating arcs to move around a circle. Our last topic in this demo discusses a 'Rotating Wheel' which uses similar arc techniques. If you look at Figure 5 there
appears in the lower right corner what looks like a wheel. We used line widths for each arc to get that figure. Here we will divide a wheel into 'sectors' of equal area and fill the region with color.
By a sector we mean a region in a circle bounded by two radii and an arc of the circle that lies between the radii. Click this thumbnail image
![]() for a good look.
for a good look.
Another wheel is a Color Wheel Chart that is not the same as a rotating wheel. Figure 11 has an example of a (famous) rotating wheel and a color wheel. A color wheel shows you how colors relate to each other and visually demonstrates the relationship between primary, secondary and tertiary colors. You can use the color wheel to develop color schemes.
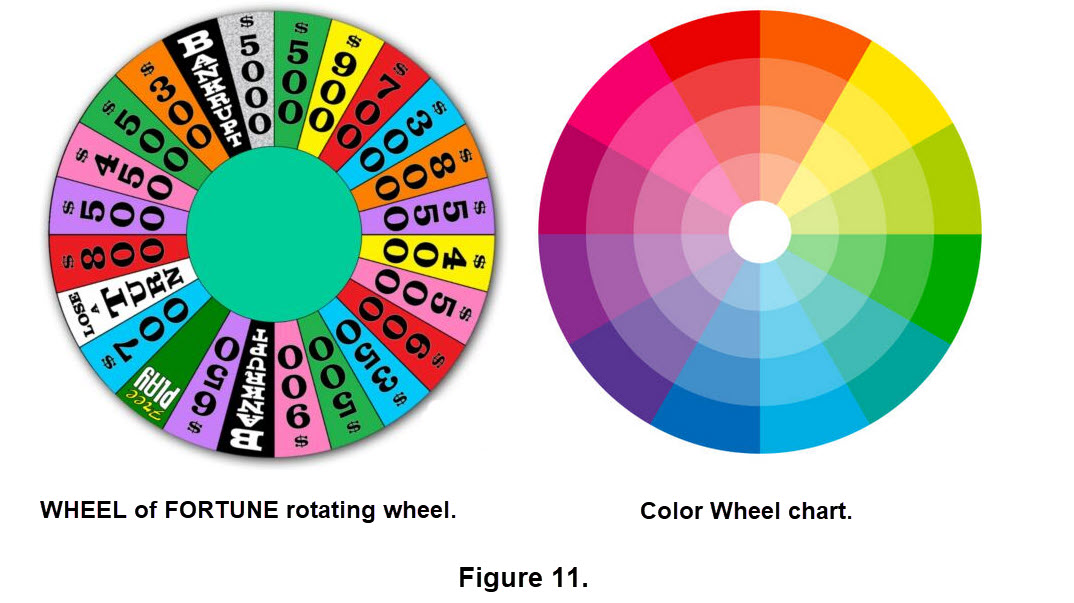
The rotating or spinning wheel we work with will be quite a bit smaller than the Wheel of Fortune. We will be able to use different numbers of sectors and a variety of colors in the sectors.
In addition, we won't need to rotate the wheel by hand. In some ways our rotating wheel will be an animation which we will briefly describe. Click this thumbnail image
![]() to see a red-white-blue wheel. (Yes, it is a bit lopsided!)
to see a red-white-blue wheel. (Yes, it is a bit lopsided!)
Spinning the Wheel of Fortune you are performing things in 3 dimensions. The wheel itself doesn't change, it moves around a circluar base. After a short time it stops. To essentially perform this action in 2 dimensions we need to break down code into a number of steps that are interrelated. For our wheel we use four major steps. The crucial step is how do we simulate rotation of the sectors? We treat the entire wheel as an object that can be rotated through a small 'rotateAngle'. (The rotateAngle is equivalent to the arc of each sector.) Then we redraw the wheel that has been rotated a single sector. Doing this small change repeatedly and very fast we get the look of spinning the wheel. (Note, OPTIONAL detail on the rotation.The procedure is done by translating the wheel to the 'canvas center', then performing the (small) rotation, and finally translating the wheel back to it's center.) Below is a table that briefly describes the four steps.
| Screen and Data | Labels, Center of the Wheel, Radius, Number of Sectors, Angles for the Arcs and Rotation | Draw the Wheel | Draw a Circle with Radii for the Sectors, Move through the Sectors choosing the Color for each Sector | Do Rotations | Rotate the Wheel, Redraw the new Wheel, keep Count of the number of rotations | Create a Spin Button | Set up 'Click Event' Code that quickly initiates a Rotation of the Wheel and determines the number of spins |
|---|
The "spin" of the wheel is fast and looks like an animation since the 'Click Event' code tells the rotation code to do its job in a few miliseconds over and over.
There is a limit to the number of rotations to be made once the 'event' is initiated so that the spin eventually stops. Click the thumbnail
![]() to see the button that spins the wheel.
You can click the button to spin again. It is recommended that you wait until the first spin finishes.
to see the button that spins the wheel.
You can click the button to spin again. It is recommended that you wait until the first spin finishes.
Our spinning wheel is for FUN. It has 10 sectors and you can choose 7 different color groups. Click the thumbnail to see our wheel
![]() . We chose not to figure out how to use this spin wheel for monetary gain, but we do have a game
that relates to things in this demo. The game has two features.
Spin the wheel several times for each of the 7 color groups or use a short cut method described in the game directions . Then for each color group do the following:
. We chose not to figure out how to use this spin wheel for monetary gain, but we do have a game
that relates to things in this demo. The game has two features.
Spin the wheel several times for each of the 7 color groups or use a short cut method described in the game directions . Then for each color group do the following:
| Color Scheme Number | HINT | Scheme Name or Pharse | Outlier Color |
|---|---|---|---|
| 1 | The earth needs them! | ||
| 2 | YUM YUM. | ||
| 3 | Spring break. | ||
| 4 | Rain on the way. | ||
| 5 | Handy page markers. | ||
| 6 | A day in March. | ||
| 7 | Intersections. |
While you can't write in the two columns on the right you could write these items on paper and compare the answers with a friend's result. (At the end of this demo is our solution. Look for it.)
To execute the game click on Spin Wheel Game. and read those directions carefully.
Wheels similer to those in our "game" can be generated by changing some basic data. In our discussions we briefly indicated features of constructing a wheel. Now lets see if you can make a short list of such important features by viewing a number of different wheels. We can generate a variety of wheels using another javascript routine where certain features are randomly changed each time you run the routine. To execute this routine click on Various Wheels. Execute the routine several times to see how things changed and make your list. In your browser in the upper left corner is a left arrow that you can click to return to the demo file so you can execute the routine again.
A short summary and potpourri (a mixture of things).
Short Summary:
An arc lays the foundation geometrically and mathematically for circles, rainbows, and wheels. Using software for an arc provided a tool to develop the javascript routines that led
to images of a variety of figures. As we moved through adding colors and gradients we extended features for more complicated figures. In today's world such figures are used in many
areas including advertisements like toothpaste
![]() ,
brand names like TARGET
,
brand names like TARGET
![]() ,
television shows like the TODAY Show
,
television shows like the TODAY Show
![]() ,
TV networks like PUBLIC TELEVISION,
,
TV networks like PUBLIC TELEVISION,
![]() ,
software suppliers like GOOGLE
,
software suppliers like GOOGLE
![]() ,
MICROSOFT
,
MICROSOFT
![]() ,
and APPLE
,
and APPLE
 and university seals like TEMPLE University
![]() .
.
The wheels are circles with sectors that have arc portions along the circumference of the circle. If we took the coordinates of the points at the start and end angles and connected them with a straight line the resulting figure would be a regular polygon. For more information regular polygons click on Regular Polygon.
Potpourri Items:
 for another example.