NEW DEMO
Regular Polygons
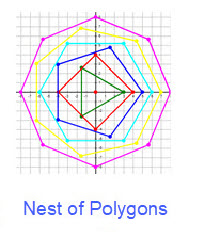
A polygon is plane figure that has a finite number of sides. The sides or edges of a polygon are made of straight lines segments which are connected end to end to form a closed shape. The point where two line segments meet is called vertex or corner. At a vertex an angle is formed. If the length of all the sides is the same the polygon is called a REGULAR POLYGON. We focus on regular polygons with 3 through 8 sides (for convenience). The figure below Nest of Polygons shows a (equilateral) triangle, a square, a pentagon, a hexagon, a heptagon and an octagon. The figure displays these regular polygons in a "nest" and the vertices are represented with a dot.
Regular polygons can be drawn in various ways. One way is to use a ruler, compass, and protractor, but this approach is quite cumbersome. We want to draw polygons using circles, trigonometry, and a computer algorithm which uses a Cartesian grid (as shown in the accompanying figure). It is easy to draw a circle on a computer using the sine and cosine functions. For values of x from 0 to \(2\pi\) use the ordered pairs (cos(x), sin(x)) and make a dot for each value of x on a cartesian grid. (See the figure below Sine & Cosine ==> Circle.)
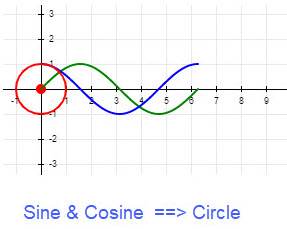
To generate the figure Sine and Cosine ==> Circle click the link MAKE A CIRCLE. This link generates the circle a dot at a time to slowly show the dots from sine and cosine. We have extended the curves so that you see the circle graphed more than once.
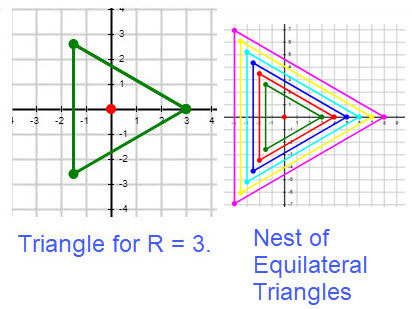
Next we use circles to help construct regular polygons. A trip around a circle has \(360^\circ\) or \(2\pi\) radians. We can plot a circle using the ordered pairs \((cos(x), sin(x))\) as x changes from 0 to \(2\pi\). This is what occurred in the figure Sine and Cosine ==> Circle. To obtain a triangular regular polygon we select only the order pairs \((cos(x), sin(x))\) for \(x = (0/3)*2\pi, (1/3)*2\pi,\) and \((2/3)*2\pi\). This provides positions for vertices that are equally spaced along a circle. To complete the points needed to graph we must consider the radius of the circle. Denote the radius by R, then our vertices are \[R*(cos(0), sin(0)), R*(cos((1/3)*2\pi)), sin((1/3)*2\pi)), R*(cos((2/3)*2\pi)), sin((2/3)*2\pi))\] For example, if R = 3, then the vertices are \((3, 0), (-1.5000, 2.5981),\) and \((1.5000, -2.5981)\). (The numerical values for the ordered pairs are shown to 4 decimal places for convenience.) When we connect the vertices, we have the equilateral triangle shown in the figure Triangle for R = 3. By choosing values for the radius R using the integers from 3 to 8 we have a nest of equilateral triangles as shown in the figure Nest of Equilateral Triangles. For ease of generating the pictures we chose the center of our circles at the origin.
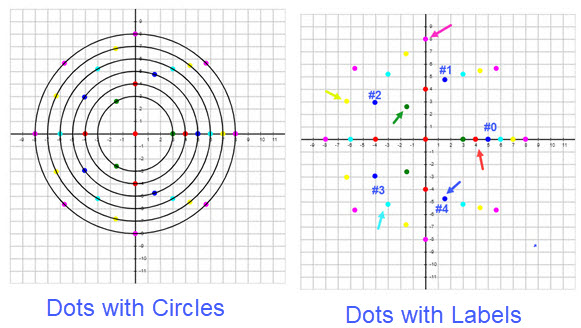
Each of the polygons with 3 to 8 sides uses a circle and equally spaced points along the corresponding circle. To illustrate the points for the polygons we use circles with a radius, respectively from 3 to 8. The set of dots along the circles are in different colors for the different polygons as shown in the figure Dots with Circles. The triangle uses green dots, the square red dots, the pentagon blue dots, the hexagon aqua dots, the heptagon yellow dots, and the octagon magenta dots. The dots on a circle are numbered starting with zero on the positive x-axis and then moving counterclockwise around the circle. For instance, the pentagon has the blue dots which are labeled 0, 1, 2, 3, 4 as shown on the figure Dots with Labels.
To examine more information about dots, circles, and graphs of polygons click the link Dots and Polygons.
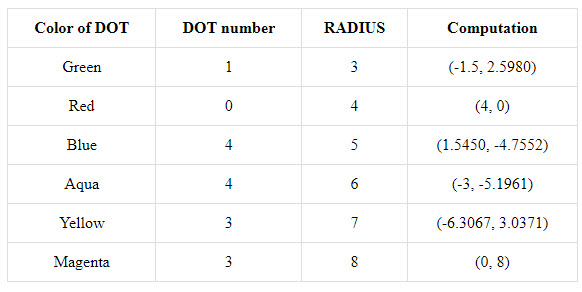
We have selected a dot from each polygon which is indicated by an arrow in the figure Dots with Labels. The coordinates of the selected dots can be computed using the number of sides of the polygon, the number of the dot from the circle, the radius of the circle that the dots are on, and the cosine and sine functions.
To formulate a method to determine the coordinates of a dot we will let R be the radius of the circle and let N be the number of sides of the regular polygon. In this approach to regular polygons the dots are numbered 0, 1, …, (N-1). The "zero" dot appears on the positive x-axis and succeeding dots are generated around the circle of radius R in a counterclockwise fashion. If the dots are visible you need to count counterclockwise to determine the DOT NUMBER. Let K be the dot number. Looking at the Dots with Labels figure for examples we selected the dots with an arrow. The following is a formula for computing the coordinates.
\[R*(cos((K/N)*2*pi), sin((K/N)*2*pi))\]
The table below gives the coordinates of the dots selected by the arrows in the figure Dots with Labels. For practice check out the coordinates of the blue dot with the arrow.
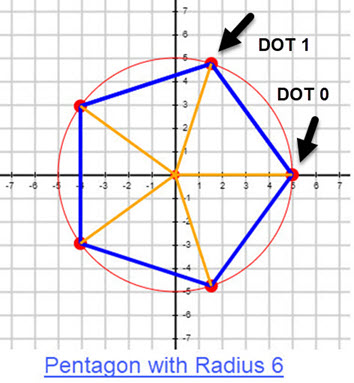
Let's summarize what we have developed so far and other properties of regular polygons. A regular polygon has equal sides. In addition, the interior angles at the vertices are also equal. For example, for a regular triangle each interior angle is \( 60 ^\circ\); for a square each interior angle is \(90^\circ\); for a regular pentagon each interior angle is \(108^\circ\); for a regular hexagon each interior angle is \(120^\circ\) degrees; for a regular heptagon each interior angle is \(128.57^\circ\); for a regular octagon each interior angle is \(135^\circ\). For related information about interior and exterior angles in polygons go to Features of Polygons. Our construction of regular polygons emphasized using circles and determining equi-spaced dots for the vertices. We develop a formula for such dots using the radius of the circle and the number of sides of the regular polygon. We can use this information to determine the perimeter and area of a regular polygon. To determine the perimeter and area we need to obtain the length of the side of the regular polygon. An easy way to do this is to determine the length of the side from Dot 0 to Dot 1. Since we have the expression for the dots this boils down to the following computational steps.
Distance from point \(R*(cos((0/N)*2\pi), sin((0/N)*2\pi))\)
to point \(R*(cos((1/N)*2\pi), sin((1/N)*2\pi)) \)
= distance from \((R,0)\) to \(R*(cos((1/N)*2\pi), sin((1/N)*2\pi))\).
For example, if we have a regular pentagon centered at the origin the distance from point \((R,0)\) to \(R*(cos((1/5)*2\pi), sin((1/5)*2\pi)) \)= distance from \((R,0)\) to \(R*(0.3090, 0.9510)\).
If R = 6 we get Dot 0 has coordinates (6, 0) and Dot 1 has coordinates \((1.8541, 5.7063)\) and the distance between them is \(7. 0534\). (The numerical values are approximate depending on the number of decimal places used in the computation.) Hence the perimeter of the pentagon is \(5* 7.0534\) which is about \(35.2670\).
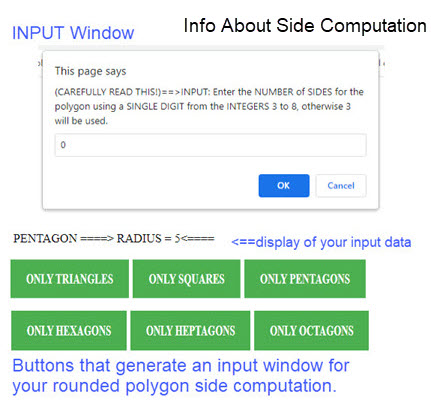
Computation of the length of the side of a polygon is needed for the perimeter as discussed above, but also for the area of the polygon which is discussed below. We have a program which you can use to 'hone' your technique for determining the length of the side of regular polygons with sides from 3 to 8, that is, triangles through octagons. The idea is you choose a polygon by entering a single digit as follows: 3 for a triangle, 4 for a square, 5 for a pentagon, 6 for a hexagon, 7 for a heptagon, and 8 for an octagon. Next you enter a single digit for the radius of a circle that contains the dots of the polygon you chose as follows: any integer from 2 to 9. WARNING: the program checks that you enter a correct digit. If a polygon selection is invalid the default value 3 is used.. In the case of an invalid radius the program defaults to a radius of 3. The idea is you compute the length of a side for your polygon using a calculator or software. Keep as many digits as you can because you must round off your side value to contain two decimal places before you enter your computation to be checked by the program. If you get a message that says 'SORRY' you were incorrect you can try again. The figure INFO About Side Computation that shows drop down windows and buttons to check your computation should give you an idea of what the program uses to get input and output. Click this link to start the program: CHECK YOUR SIDE COMPUTATION.
Try choosing hexagons with various choices for the radius. Just looking at the figures you should be able to write down the length of the sides. Sometimes hexagons are called the BESTAGONS. Click here BESTAGONS to see why.
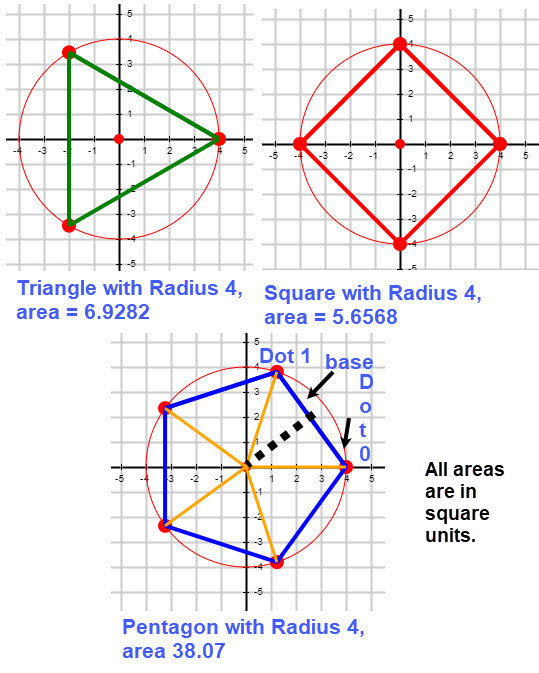
We showed how to compute the perimeter of a regular polygon centered at the origin. Now let's determine how to compute the area. For triangular polygon the area is easy to compute since the it is an equilateral triangle. We merely compute the length of the side and use the formula for the area, A, of an equilateral triangle which is \[A=\frac{\sqrt{3}} {4}*S^2\] For a square polygon the area is easy to compute since it is \[A = S^2\]
Look at the figures for the Triangle and Square with Radius 4 in the display below.
Unfortunately for regular polygons with more than 4 sides computing the area requires more work. There are several approaches for the area in these cases. Let's start by using some geometry. For these regular polygons the figures are sub divided into isosceles triangles, the same number N as the sides of the polygon. The two equal sides have the same length as the radius of the circle. Hence the area of the polygon is N, the number of sides, times the area of any of the isosceles triangle. The area of an isosceles triangle is one half the base, b, times the height, h. That is, \(A = \frac{1}{2}b*h\). We can compute the base by finding the distance from Dot 0 to Dot 1 (or any other pair of consecutive dots). To find the height of the isosceles triangle find the midpoint of the side between Dot 0 and Dot 1, then find the distance from the origin to the midpoint of the base. This procedure is illustrated in the figure of the Pentagon with Radius 4. The same procedure applies to any regular polygon. Follow the procedure to verify that the area of the pentagon with radius 4 is correct.
This was mathematics at work. But mathematics has been around for a long time, hence it is reasonable that there is a general formula for the area of a regular polygon. Let N be the number of sides in the polygon and S be the length of the sides, then the area of the polygon can be computed using the formula $$A=\frac{NS^2}{4\tan\Big(\frac{\Large\pi}{N}\Big)}$$
This formula requires the length S of the side of polygon. We previously developed a way to compute S provided we had certain information, especially the radius R for a circle that goes through the vertices of the polygon and of course the number of sides N of the polygon.
You can have a hands-on experience involving polygons with 3 to 8 sides. You select your polygon and the program sets the radius of the circle containing the vertices to the same value as the number of sides of the polygon. You will be able to check your computation. For the area INPUT, enter the area you computed for the polygon after you round it to a whole number. Only enter the input as integers. To use this program, click this link CHECK YOUR AREA COMPUTATION. The program lets you try again if your computation is incorrect, just click the button on the page.
We developed a procedure for generating the graph of a regular polygon using circles centered at the origin and equi-spaced vertices around the circle. The vertices were connected to get our graph and if needed we could draw the radii from the origin to the vertices. We then developed a way to compute the length of the sides of the polygon which gave us a way to measure the perimeter and the area. Using these techniques, we want to briefly investigate individual sets of the same polygon that can be graphed by choosing different radii for the basic circle that leads to the graph of the regular polygon. In this case we will use 3 to 10 sided polygons and radii from 2 to 10 units. We refer to the sets of polygons as "nests". (An example of the nest of equilateral triangles appears in an early figure; to see the nest, click this link TRIANGLE NEST .)
" Mathematics is the study of patterns. Studying patterns is an opportunity to observe, hypothesis, experiment, discover and create. By understanding regularities based on the data we gather we can predict what comes next, estimate if the same pattern will occur when variables are altered and begin to extend the pattern." Click here for the source of the quote. Pattern Power. In addition, click here for more information. WIKIPEDIA.
The question that arises is what type of patterns might we find? It could be that certain nests are more pleasing to the eye or possibly behaviors of perimeter or area. We have added two more polygons, the nonagon (9 sides) and the decagon (10 sides). To see the polygons with the two new ones click this link ADDITIONAL POLYGONS .
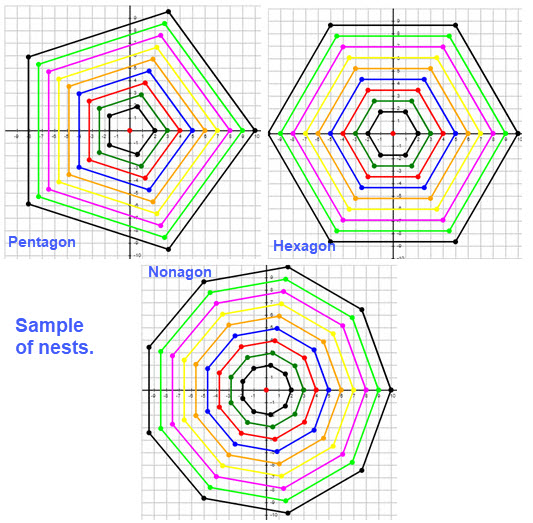
Let's consider a visual inspection of the 8 nests (triangle through decagon) which use radii of 2 through 10 units. One possible thing to look for is (geometrical) symmetry. There are several small images to the right, but you can get a better view by clicking on the link NESTS of POLYGONS. If you use the link, take your time and try to keep things simple. Write a few notes about what you think is a pattern. Maybe it will be helpful when we look at some data, which is our next topic.
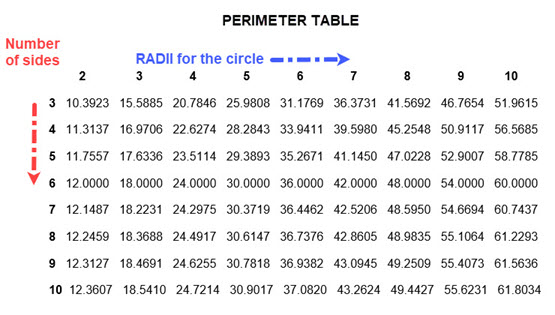
The essential meaning of data as given in the Merriam-Webster dictionary is: "facts or information used usually to calculate, analyze, or plan something". In our case we are hoping to find patterns. The first two possibilities are area and perimeter of regular polygons. Since we have 8 types of regular polygons that use radii from 2 to 10 generating data is reasonably easy to get. Recall that we know how to determine the area and permeter, its just a matter of organizing the data. We have constructed one table for areas for a given polygon for each choice of radii. In effect this uses the nest of the polygon. We can build a similar table for perimeters.
Looking at the area table below one pattern jumps out; the areas for squares (the row labeled with 4) are whole numbers for each radius.
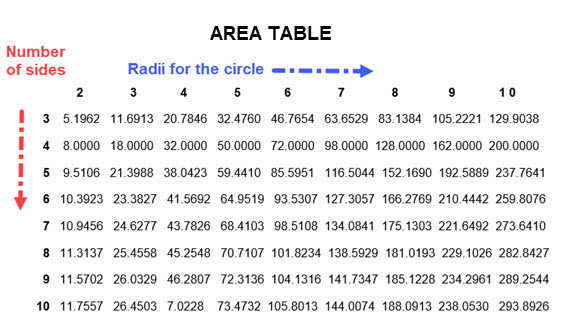
The other rows show area values to four decimal places rounded and are more difficult to formulate a pattern.
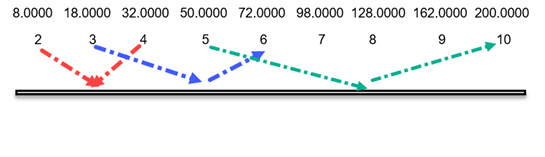
But, let's look again at the row of areas labeled as 4 for square regular polygons and corresponding radii.
| \[ \begin{array}{|c|c|} \hline \text{AREA:} & \text{8} & \text{18} & \text{32} & \text{50} & \text{72} & \text{98} & \text{128} & \text{162} & \text{200}\\ \hline \text{RADIUS:} & \text{2} & \text{3} & \text{4} & \text{5} & \text{6} & \text{7} & \text{8} & \text{9} & \text{10}\\ \hline \end{array} \] |
If we double the radius from 2 to 4 the area has been multiplied by 4. If we double the radius from 3 to 6 the area has been multiplied by 4. If we double the radius from 5 to 10 the area has been multiplied by 4.
If we could extend the collected data this pattern of behavior is repeated. To check this out use heptagon data. Look at the row labeled as 7, which is shown below, where things are not as exact because we only have 4 decimal places, but the pattern still seems to be true. Use your calculator to check it out.
| \[ \begin{array}{|c|c|} \hline \text{10.9456} & \text{24.6277} & \text{43.7826} & \text{68.4103} & \text{98.5108} & \text{134.0841} & \text{175.1303} & \text{221.6492} & \text{273.6410} \\ \hline \end{array} \] |
To see the heptagon figures with radius 4 and 8 click this link HEPTAGONS with RADII 4 and 8 .
This time we look at the perimeter table below. Inspect the perimeters for hexagons (the row labeled 6). The contents are whole numbers. Maybe the pattern we found for areas will be present here. If you look carefully at this row you should see that doubling the radius multiples the perimeter by two, so we have different patterns.
So, for regular polygons we found individual patterns for area and perimeter. We have used data and observations to "suggest" that the patterns work for all cases. But we have not proven that this is the case. To prove this we need to apply mathematics. Since we have formulas for the area and the perimeter we could apply some algebra to determine if the individual patterns apply in all cases.
Earlier we stated the formula for the area of a regular polygon as \[A = \frac{NS^2}{4tan(\frac{\pi}{N})}\]
But there is an alternative formula that uses the radius R of the circle instead of S the length of the side polygon (mathematics at work again). This formula is \[A = \frac{1}{2}\frac{NR^2}{sin(\frac{2\pi}{N})}\]
If we double the radius, we get the area of resulting polygon is \[NEWarea = \frac{1}{2}\frac{N(2R)^2}{sin(\frac{2\pi}{N})}\]
So, the original area is multiplied by 4.
To determine the perimeter we proceed as follows. For a regular polygon with N sides the length S of a side can be determined by computing the distance from Dot 0 to Dot 1 as discussed earlier. We didn't provide a formula for S but it is advantageous to do so now.
The distance S from Dot 0 to Dot 1= distance from \((R,0)\) to \(R*\Big(\cos\Big(\frac{2\large\pi}{N}\Big),\sin\Big(\frac{2\large\pi}{N}\Big)\Big)\) .
Using the formula for the distance between two points and doing some algebraic simplification we get
\[ S=R*\sqrt{\Big(1- \cos\Big(\frac{2\large\pi}{N}\Big)\Big)^2 + \sin^2\Big(\frac{2\large\pi}{N} \Big)} \]
If we replace R by 2R, we obtain
\[ NEWside=2*R*\sqrt{\Big(1- \cos\Big(\frac{2\large\pi}{N}\Big)\Big) ^2 + \sin^2\Big(\frac{2\large\pi}{N} \Big)} = 2S \]
To compute the perimeter multiply the side length by N, the number of sides of the regular polygon.
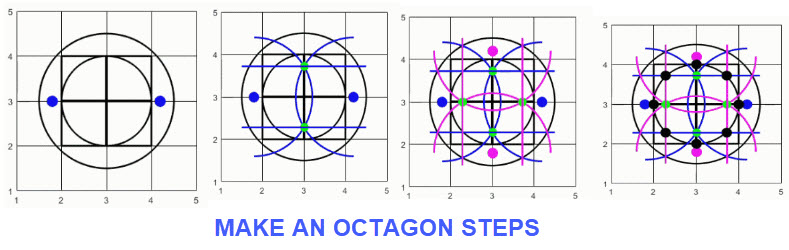
We focused on using technology and mathematics to develop a graphical technique for getting figures of regular polygons. Some of the efforts to present the ideas developed were really stimulated by looking at procedures for obtaining a picture of a regular octagon that used a straight edge and compass with geometry. You can find the steps involved by clicking this link MAKE AN OCTAGON . It seemed that a convenient way to mimic the steps that used geometry with a compass and a straight edge was to use MATLAB. A program was developed that did the job. We have developed a slide show that provides a step-by-step look at the construction of an octagon in this fashion. The accompanying figures below show several steps. Click this link OCTAGON SLIDE SHOW to use the slide show.
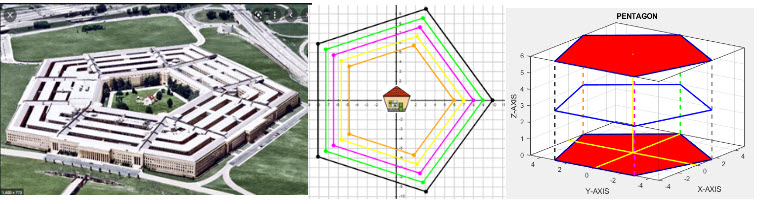
Regular polygon shapes are often used in the building of modern structures. One such building is the Pentagon, located in Arlington County, Virginia, across the Potomac River from Washington, D.C. The Pentagon is the headquarters of the United States Department of Defense. "Constructed during 1941-43, the Pentagon was intended to consolidate the offices of the War Department, which had occupied 17 separate facilities throughout Washington." For more information, click the following link: PENTAGON from the BRITANNICA .
"It has limestone walls. It is in the shape of a pentagon, and has seven floors. The Pentagon is the largest office building in the world, but any place in the building can be reached within 7 minutes. It has a total floor area of 6,500,000 sq ft (604,000 \(m^2)\). Offices are 3,700,000 sq ft (344,000 \(m^2\)). Approximately 25,000 military and civilian employees work in The Pentagon. It has five sides, five floors above ground, two basement levels, and five ring corridors per floor with a total of 17.5 mi (28.2 km) of corridors. The Pentagon includes a five-acre (20,000 \(m^2\)) central plaza, which is shaped like a pentagon." For more information, click the following link: PENTAGON from the WIKIPEDIA .
Below there is a picture of the PENTAGON and a corresponding nest of pentagons. While we can't view the interior of the Pentagon, we can illustrate the construction of a small 3D pentagon structure and other polygon structures. To see a slide show click this link : 3D_PENTAGON SLIDE SHOW.