NEW DEMO
Simulation of a RAINBOW
We have been fascinated by the phenomena of a rainbow throughout time.
It was Sir Isaac Newton's experiment with light passing through a prism that revealed a band of colors varying from red to violet.
The colors of the band are violet, indigo, blue, green, yellow, orange, and red.
(A mnemonic that is often used to recall these colors is VIBGYOR or Richard Of York Gained Battle In Vain. An alternate form, ROY G. BIV is also used. We will use roygbiv.)
Click the thumbnail ![]() for a good look.
For a bit of history about Newton and roygbiv click here Newton color.
for a good look.
For a bit of history about Newton and roygbiv click here Newton color.
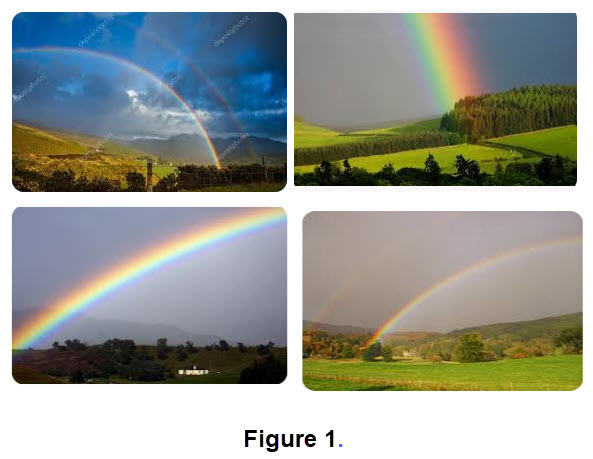
Figure 1 displays several rainbow spectrums from photos. Use your browser to find more images.
Newton concluded that white light is really a mixture of colored lights, and that each color bends differently as it passes through a prism. Thus we see the band of colored light which is called the visible spectrum. The light we can see is but a portion of the huge spectrum of energy called electromagnetic radiation. For more information click the following for a brief summary Refraction and Dispersion. or for a more in depth discussion click on Refraction and the Ray Model of Light.
Source: T. Smith, Taylor County School System, Butler, Georgia
There are other prism animations that use waves and beams of light. To see these click on the following: Wave dispersion. or Beams.
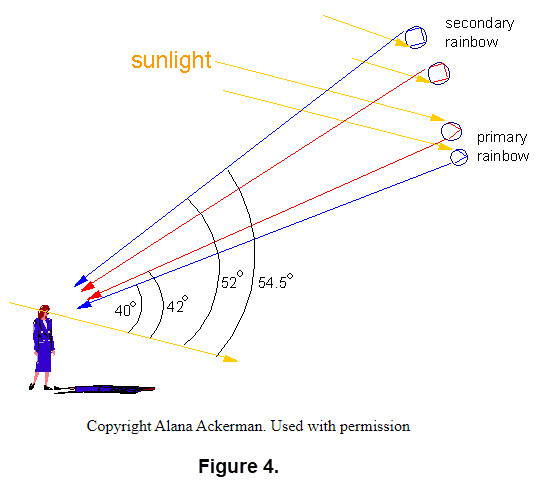
Rainbow: A rainbow is formed by light from the sun hitting a raindrop. When this occurs the light is refracted (the change of direction of light in passing from one medium to another) into the colors of the spectrum and then reflected (the return of the light from striking a surface) off the back of the raindrop. For more details see Figure 2 and the description below it.
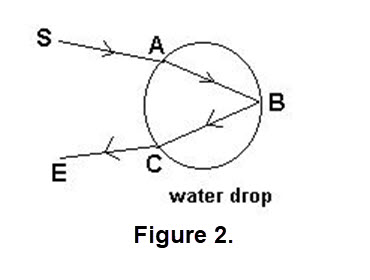
A light ray hits the drop from direction SA. As the beam enters the drop it is refracted (bent) and then strikes the back wall of the drop at B. It is reflected off the back wall of the drop towards C. As it emerges from the drop at C it is refracted (bent) again. (Not all rays hitting a drop undergo 'total internal reflection'; see Figure 3.)
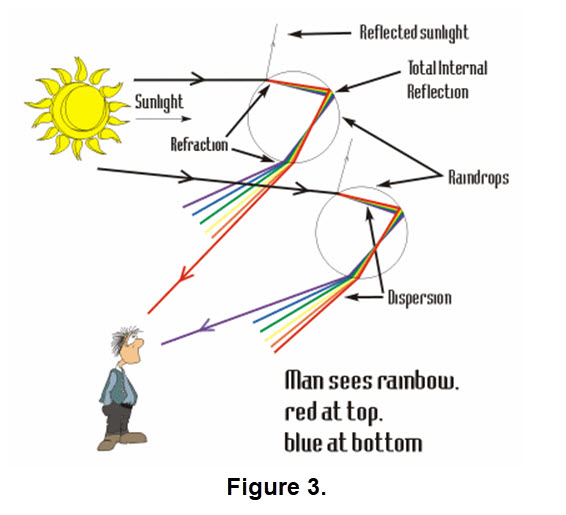
Figure 3 is Copyrighted by Rebecca Paton. Used with permission. (Rebecca has a very nice site devoted to aspects of rainbows.)
The reflected light is refracted as it exits the drop. Each color of the spectrum is refracted at a slightly different angle depending upon it's wavelength.
Violet light (bending the most) emerges at an angle of 40 degrees relative to the incoming
sunlight while red light (bending the least) exits the drop at an angle of 42 degrees.
Other colors of the rainbow leave a raindrop at angles somewhere in between 40 and 42 degrees.
The primary rainbow always appears at an angle centered at about 41.5 degrees from the sun.
As the spectrum of light emerges from the drop an observer on the ground will see only one color depending upon the angle of observation.
Keep in mind that only one color of light is observed from each raindrop, an incredible number of raindrops is required to produce
the magnificent spectrum of colors that are characteristic of a rainbow. There is a nice diagram about wave length and angles from Wikipedia. Click on the thumbnail
![]() .
.
The rainbow we normally see is called the primary rainbow and is produced by one internal reflection within the drop.
When conditions are just right a fainter larger secondary rainbow with colors in reverse order appears. For an example click here
![]() (Also see two the pictures in Figure 1.) This is the result of rays undergoing a second reflection within the drop.
It is possible for light to be reflected more than twice within the drop, giving rise to higher order rainbows, but these are rarely seen.
Click here for more information from National Geographic:
(Also see two the pictures in Figure 1.) This is the result of rays undergoing a second reflection within the drop.
It is possible for light to be reflected more than twice within the drop, giving rise to higher order rainbows, but these are rarely seen.
Click here for more information from National Geographic:
![]()
Figure 4 illustrates the angles for primary and secondary rainbows.
Build a DEMONSTRATION Model for the Simulation of a Rainbow.
In order to a accomplish this goal we need two parts; simulation technique and the mathematical data for reflection and refraction.
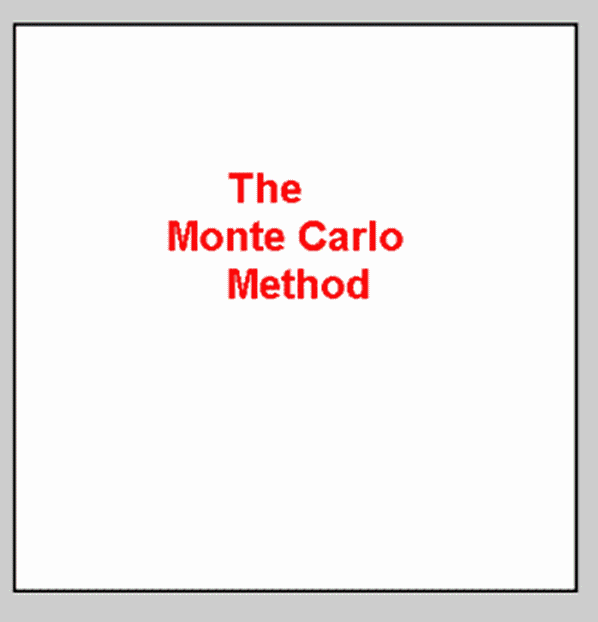
For the simulation we will use the Monte Carlo Method. Here is a brief explanation of the method and how it works.
- The Monte Carlo Method is a computerized mathematical technique that allows people to quantitatively account for risk in forecasting and decision-making. At its core, the Monte Carlo Method is a way to use random samples of parameters to explore the behavior of a complex system.
- Simulate processes that are time consuming.
- Run a large number of experiments in a short time-frame.
- Quickly adjust and repeat experiments.
For more information on the Monte Carlo Method click on one of these: Monte Carlo Methods and Simulations. or What Is a Monte Carlo Simulation?. There are many descriptions available on the web.
Below is an animation of throwing darts at a yellow circle on a square board. The square board is 7 by 7 and the circle has a radius of 2. The darts are thrown randomly some hitting in the circle and others hitting outside the circle for simulation. The idea is to determine the percentage of the darts that hit the yellow circle compared to the total of darts thrown. This technique lets us estimate the approximate size of the circle on the board by computing the number of darts in the circle divided by the total number of darts thrown for a simulation. By repeating throws with different numbers darts we illustrate the simulations of the Monte Carlo method. (See the description of the Monte Carlo method above.) Note that when we repeat the total number thrown the estimated solution can change for the simulation. In this demo we know how to obtain the solution since we have the data on the size of the board and the circle, hence we can compute that the circle is (about) 25.646% of the board. In a real world situation we probably need a large number of experimental simulations to estimate a solution of a problem.
PROBLEM: Suppose we had a circle of radius R on a square board with side 2R. Using the same idea of throwing darts as outlined above, what percentage of the board is taken up by the circle? Explain how to use this to approximate a famous number.
EXERCISE 1.
We have dart board that you can use to experiment the Mont Carlo method discussed above and the gif file shown above. In this activity you will control the number of darts 'thrown' at the board and
certain information about the simulation will appear with the figure of the board. The object of the activity is for you to determine the radius of the circle that appears on the board. Click here
![]() to see a picture of the board. The routine changes the circle each time you use the activity. The information that you need to determine the radius is listed below. You will need to record this
information as it appears on the screen so that you can use algebra to find the radius.
to see a picture of the board. The routine changes the circle each time you use the activity. The information that you need to determine the radius is listed below. You will need to record this
information as it appears on the screen so that you can use algebra to find the radius.
- Record the number of darts you chose to "throw". There are some restrictions in the first drop down window.
- The estimation of the percent of area of the board taken up by the circle will be displayed as a number like 29.31445, usually. Note the 5 decimal digits. Record this number. Do you know how it was computed?
- The difference in percent of the actual portion of the square taken up by the circle will be displayed. It can be a positive or negative number with 5 decimal points, usually. Record this value.
- A code for the type of circle in your experiment will be displayed as an integer; you need to record this.
- With the data from the picture and the items you record determine the radius of your circle. You need to record your computation together with your code in order to have it checked. More on how to check your computation of the radius will follow.
There is a small window that appears for each of items 1-4 above. The following figure is a sample.

To use the activity for determining the radius of your circle, click here Find the RADIUS of your CIRCLE.
EXERCISE 2.
We have another dart board that you can use to experiment with the Mont Carlo method. This dart board has a circle and a diamond on it; click here
 to see the board. Imagine that the board is hung on a wall and that the people that throw darts are not careful (for various reasons) so that a number of tosses will not appear as a dot on the board at all.
From the picture notice there are three regions where darts can hit the board; the portion of the board with black dots, the diamond with red dots, and the circle with green dots.
The board is 20 by 20 units. Your goal is to estimate the percentage of the area of the board taken up by each of the following regions:
the space with black dots, the space with red dots, and the space with green dots. As a REMINDER: not all thrown darts hit the board.
The routine will give you the number of darts that hit in each of these three regions; the numerical values will appear in a drop down window like that shown in EXERCISE 1.
To use the routine for the second EXERCISE click here
Find the Percent of Area of the three regions.
to see the board. Imagine that the board is hung on a wall and that the people that throw darts are not careful (for various reasons) so that a number of tosses will not appear as a dot on the board at all.
From the picture notice there are three regions where darts can hit the board; the portion of the board with black dots, the diamond with red dots, and the circle with green dots.
The board is 20 by 20 units. Your goal is to estimate the percentage of the area of the board taken up by each of the following regions:
the space with black dots, the space with red dots, and the space with green dots. As a REMINDER: not all thrown darts hit the board.
The routine will give you the number of darts that hit in each of these three regions; the numerical values will appear in a drop down window like that shown in EXERCISE 1.
To use the routine for the second EXERCISE click here
Find the Percent of Area of the three regions.
You will need to enter as input the number of darts you want to throw; there are some restrictions. From these four items of data you can estimate the percentage of the area for each region. Once you have computed your estimates, use the button on the lower left side that says Click to Test the ACCURACY of your estimates.
CAREFULLY follow the directions in the drop down windows. It very important to keep four decimal places in your estimates. To check your estimates use the three green buttons;
click here
![]() to see this portion of the "checker". Do not to expect to see a response in the checker that says "CORRECT", unless you happen to be very lucky! Other responses let you know if
your estimate is close or needs to be recomputed.
to see this portion of the "checker". Do not to expect to see a response in the checker that says "CORRECT", unless you happen to be very lucky! Other responses let you know if
your estimate is close or needs to be recomputed.
EXERCISE 3.
This is something different from Exercises 1 and 2. We were originally going to follow the idea of Monte Carlo like the previous exercises until a student noticed that the figure
![]() in the thumbnail can be used directly to compute the percent of area in the circle taken up by he equilateral triangle algebraically. Click here
Find the area percentage.
to see a larger figure with directions to make this computation.
in the thumbnail can be used directly to compute the percent of area in the circle taken up by he equilateral triangle algebraically. Click here
Find the area percentage.
to see a larger figure with directions to make this computation.
MATH DATA: In order to develop a mathematical model to simulate a rainbow we need information about the features of a ray of light hitting a droplet of water.
This requires familiarity with the laws of reflection and refraction as well as the speed of light in various mediums.
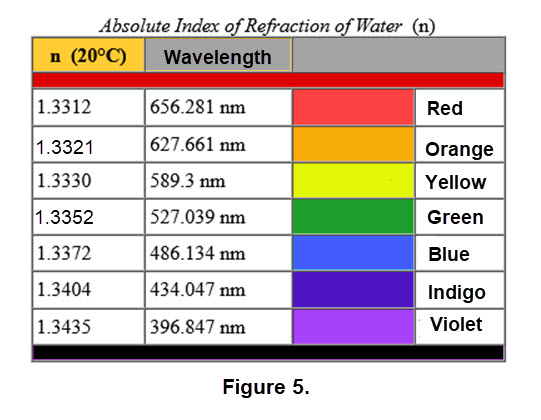
While the internet might tell you that the refractive index of water is 1.33, it is actually a function of the wavelength of the light,
as well as the salinity, temperature, and pressure of the water.
A refractive index is a value calculated from the ratio of the speed of light in a vacuum to that in a second medium of greater density.
The refractive index variable is most commonly symbolized by the letter n in descriptive text and mathematical equations.
The total deflection of the ray from its original direction is D = 180+2i-4r,
where i is the angle of incidence when the ray first hits the drop and r the refraction angle at first contact.
Figure 5 displays information on the refractive index of colors based wavelength. Note that the index is quite tight numerically, that is, the roygbiv indexes do not change very much.
(Figure 5 came from several sets of data and contains several approximations. Click
![]() here to see a broader set of data.)
The higher index of refraction for violet means that violet light is the most bent, and red is then the least bent because of its lower index of refraction,
and the other colors fall somewhere in between.
So using these similar numerical values provide a warning when employed by computations.
For detailed information on these topics see the references at end of this demo.
We will take an approach using some existing code that requires only the retractive index of the roygbiv colors.
When the air is full of water, like after a rainstorm, the water droplets act like a prism and can make a rainbow.
here to see a broader set of data.)
The higher index of refraction for violet means that violet light is the most bent, and red is then the least bent because of its lower index of refraction,
and the other colors fall somewhere in between.
So using these similar numerical values provide a warning when employed by computations.
For detailed information on these topics see the references at end of this demo.
We will take an approach using some existing code that requires only the retractive index of the roygbiv colors.
When the air is full of water, like after a rainstorm, the water droplets act like a prism and can make a rainbow.
For this demo we will use a computational technique that appeared in the work of the publication
D. Olson, et al., "Monte Carlo Computer Simulation of a Rainbow", The Physics Teacher, April 1990, pp. 226-227.
Click here Code for Rainbow Simulation. to see a copy. Note that the algorithm is written
in Applesoft Basic. There is a bit of "history" regarding why we will use this approach. First, we had A Guide to Programming in Apple Soft
![]() which was kept around since we had Apple I and II from long ago. (It is available on AMAZON.) The code focused on using colors red, green, and blue. Second,
we used this approach as part of an NSF project Demos with Positive Impact, DUE-995206 (A Project to Connect Mathematics Instructors with Effective Teaching Tools) which
ran for almost 20 years and was well recognized by rewards from outside organizations.
We wrote MATLAB code and extended the colors to all those in roygbiv together with graphics of the rainbow with several variations.
The project was taken off the web about 5 years ago, primarily because so many new tools are now available to help instructors.
Third, we have been able to convert the MATLAB code to javascript (available latter) which performs much better and provides better graphics.
which was kept around since we had Apple I and II from long ago. (It is available on AMAZON.) The code focused on using colors red, green, and blue. Second,
we used this approach as part of an NSF project Demos with Positive Impact, DUE-995206 (A Project to Connect Mathematics Instructors with Effective Teaching Tools) which
ran for almost 20 years and was well recognized by rewards from outside organizations.
We wrote MATLAB code and extended the colors to all those in roygbiv together with graphics of the rainbow with several variations.
The project was taken off the web about 5 years ago, primarily because so many new tools are now available to help instructors.
Third, we have been able to convert the MATLAB code to javascript (available latter) which performs much better and provides better graphics.
What follows is a non technical summary of the information we need in order to produce an elementary simulation of a rainbow. We understand that the velocity of light is dependent upon the medium through which it passes, like air or water. The change in velocity of light as it passes say from air to water cause the refraction/bending, described above. The refraction index or index of refraction is the ratio of the velocities of light in the two media. The code in the javascript version of "Monte Carlo Computer Simulation of a Rainbow" uses the refraction indices of the colored light to set up the appropriate angles of refraction and reflection in our simulation. This information together with algebra and trigonometry can be blended to model the color dispersion we see in the phenomena of a rainbow. (See some of the references below for more details.)
The Model:
Imagine a large number of parallel rays hitting spherical rain drops. For each ray we plot a single point of light in accordance with the laws of reflection and refraction. For each ray of light we randomly choose a color that will be seen by an observer once it has been refracted and reflected either resulting in a point of light in the primary or secondary rainbow. Since we are randomly assigning a color from the spectrum to a ray, the process is using a Monte Carlo simulation. In order to get the angles correct we use the refraction index of the colored light for the mediums air and water. This also determines the placement of the corresponding dot of light in our picture.
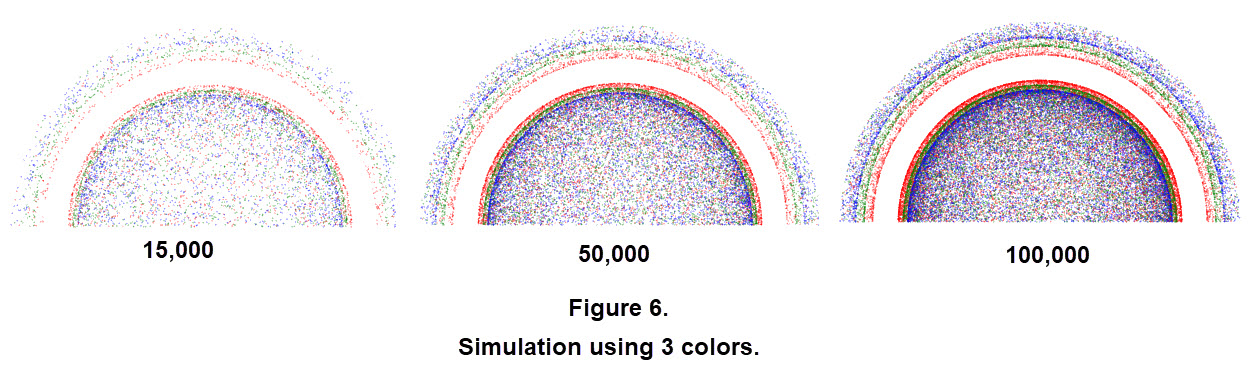
We will start using 15,000 rays for a simulation. In this simulation we have used only the three primary colors red, green, and blue for simplicity. Even with this small number of rays the primary and secondary rainbows are evident, with of course a lot of 'scatter' within the primary arc. With larger numbers of rays the result is a stronger definition of both the primary and secondary arcs. See Figure 6.
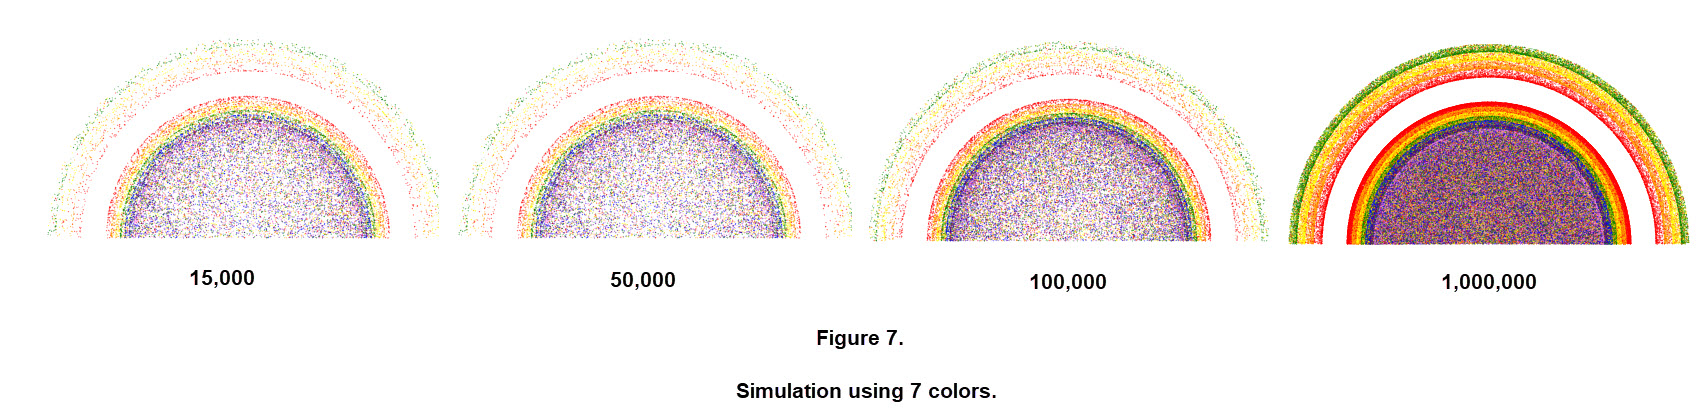
A simulation using the seven colors of the rainbow, roygbiv, was performed in a similar manner. The primary and secondary are shown in Figure 7, for even a small number of rays the bands display the colors. As the number of rays increase the bands are larger and sharp but the darker colors do not appear in the secondary rainbow. The small modification of the javascript code for the seven colors code required more information for the refraction indices of the other 4 colors of light. We also experimented with several million rays and found that the arcs did maintain the color order and of course did change significantly in intensity. (We compared the arcs here with those from using our previous MATLAB code. Figures 6 and 7 here are similar, a bit sharper, and were produced much faster. In fact, with a million rays in MATLAB it took significantly longer to complete the image.)
If the water droplets are sea water then the index of refraction of the water changes to about 1.34 and those for the colors in the visible spectrum also change a bit. Here we experimented with only 3 colors. By altering the indices we can simulate a sea water rainbow as shown in Figure 8.
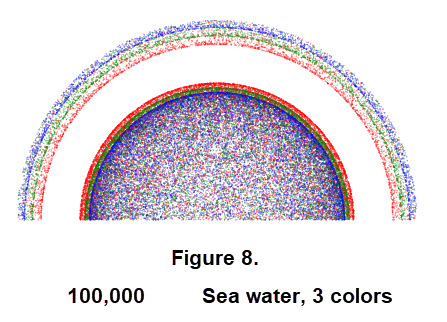
Comparing Figure 8 with the 100,000 image in Figure 6 we see that the bands are similar. In the secondary rainbow the bands are thinner and the bands in primary rainbow are about the same. It also seems that the separation of the two rainbows is larger.
Software you can access
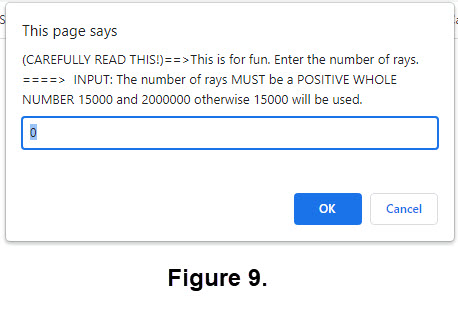
There are 3 routines that you can use. Just recall that this is a demo and you can have fun looking at the rainbows. Each of the routines lets you enter the number of rays to use with the Monte Carlo simulation. You can choose between 15,000 and 2,000,000 rays. When you click one of thee items below you will see the following display which contains more information. Just enter the number of rays and click OK. The rainbow will be displayed in a short time; have patience.
For a rainbow using 3 colors and ordinary water click here: RAINBOW 3 colors with ordinary water.
For a rainbow using 7 colors and ordinary water click here: RAINBOW 7 colors with ordinary water.
For a rainbow using 3 colors and salt water click here: RAINBOW 3 colors with sea water.
If you would like a copy of these javascript routines please email us. You can change the colors in the code to have some fun.
Click on these thumbnails; ![]() and
and ![]() .
Also keep in mind this is a demonstration not a research paper.
.
Also keep in mind this is a demonstration not a research paper.
Other atmospheric views
There are other colorful atmospheric phenomena. For instance, most days we have opportunities to see sun rises and sun sets which can have a multitude of fantastic colors
like the following thumbnails. Click to see colorful skies;
![]()
![]() .
.
In an article in the National Geographic Magazine (February, 2023, Page 32) entitled MOON VIEWS IN RAINBOW HUES there are photos of our moon in "varied colors when the moon
is seen or photographed through stratified and irregular gas layers of Earth's atmospheric blanket". For instance here is a purple moon; click here
![]() .
. For more from the National Geographic Magazine article, together with a picture of 48 moon images in a"spiral montage" and the photographer, click here
Article MOON VIEWS.
.
. For more from the National Geographic Magazine article, together with a picture of 48 moon images in a"spiral montage" and the photographer, click here
Article MOON VIEWS.
References
There are a large number of web sites that contain information on rainbows. There are sites that have many images for water droplets, prism color displays, and mathematics regarding refraction indices. Several that were helpful in creating the descriptions in this demonstration are listed in the references.
But here is a DO-IT-YOURSELF. You can construct your own rainbow with a garden hose under the right conditions. Click here
![]() to see a 'backyard' rainbow. (Photo used with the permission of Dr. Paul Perlmutter.)
to see a 'backyard' rainbow. (Photo used with the permission of Dr. Paul Perlmutter.)
- Wikipedia Refractive
- Wikipedia Rainbow
- AMS fcarc-rainbows
- AMS The Mathematics of the Rainbow, Part II
- About rainbows
- Rainbow simulation
- Refractive Index
- Index of Refraction of Seawater and Freshwater as a Function of Wavelength and Temperature
- Monte Carlo simulation
- Monte Carlo Simulation: How it Works
- Monte Carlo Methods and Simulations explained in real-life: modeling insomnia
- In your browser search for 'images of rainbow prism colors'
- In your browser search for 'images of refraction of light'
Postscript
An article appeared in the National Geographic Magazine (03.2023, page 20) entitled Rainbow rich, climate poor, by Alejandra Borunda, which deals with rainbows in our current atmosphere.
"Some cultures consider rainbows omens of danger. A new study says climate change may cause more rains - and possibly rainbows. As major weather patterns morph because
of warming, the prismatic displays may increase, especially near the planet's poles."
Alejandra Borunda, is an Environment Writer at National Geographic. A browser search using her name yields a list of her contributions. A particular one that may be of interest is
Climate Change and Shade.
The colored dots in the image of a rainbow are formed by creating an arc of 360 degrees with a small radius and then filling it with the correct color. A standard image for a rainbow is
![]() .
You can find out more about arcs and how to draw a standard rainbow at
Arcs, Circles, and Wheels.
.
You can find out more about arcs and how to draw a standard rainbow at
Arcs, Circles, and Wheels.
Our demonstration followed closely the contents of the publication D. Olson, et al., "Monte Carlo Computer Simulation of a Rainbow", The Physics Teacher, April 1990, pp. 226-227. From the paper: "The simulated rainbow is generated by plotting many single points in accordance with the laws of reflection and refraction applied to a large number of parallel rays of light incident on a sphere of water. The features of actual rainbows - primary and secondary rainbows at the correct angles with colors in correct sequences, the diffuse white illuminations just inside the primary, and the dark band between the primary and secondary bows - are produced by the computer from these simple laws of geometric optics acting on thousands of incident rays."
We felt that we needed to provide more information of refraction/reflection components to emphasize that there is a lot of mathematics going on behind the production of a rainbow with 'dots' of color without getting deep into the associated sciences of light. We tried to keep things in a general mode. There were several places where we had to estimate some numerical values and others where we found that the close numerical indices of refraction values did not yield rainbow style figures. We used some data that extended the pattern used in the paper so we could demonstrate rainbows in roygbiv colors. We know that our figures of the plotted rainbows appear opposite to "diffuse white illuminations just inside the primary, the dark band between the primary and secondary bows" but we felt that the images were indeed demonstrations for rainbows. It seems reasonable that there is other similar work available but our searches didn't lead us there. If you as a user have more reports on similar simulations please contact us.
We had a lot of fun extending this type of rainbow demonstration from our previous work in the collection of demos in NSF project Demos with Positive Impact, DUE-995206 (A Project to Connect Mathematics Instructors with Effective Teaching Tools).